
By Caleb Billingsley, Performance Expert at Foulk Consulting
Most executives don’t reject performance engineering budgets.
They simply don’t understand the data being used to justify them.
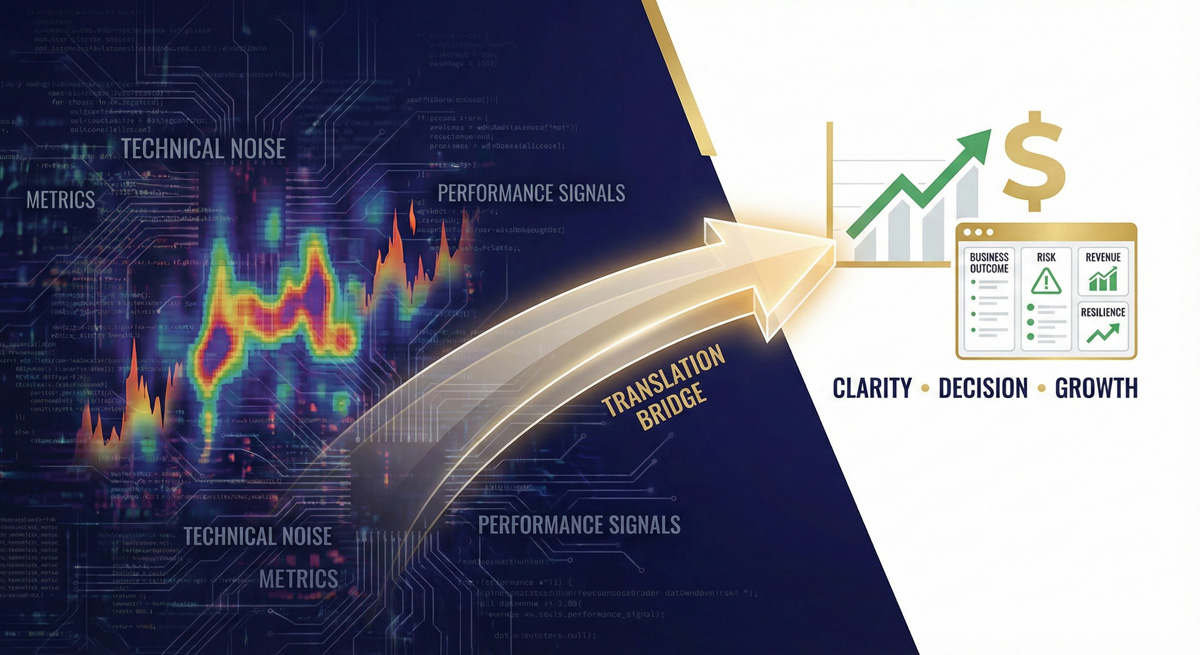
Latency charts. Percentiles. Apdex scores. Heat maps.
To a performance engineer, these are signals.
To a CFO, they’re noise.
This disconnect creates what I call the Performance Literacy Gap—and it’s one of the biggest reasons organizations underinvest in observability, performance testing, and proactive monitoring until after a major incident occurs.
The Core Problem: Metrics Without Meaning
Performance teams are often asked some version of the same question:
“Why should we spend more on this if the system is technically ‘up’?”
The answer usually exists in the data—but not in a language the business uses to make decisions.
Executives don’t manage milliseconds.
They manage risk, revenue, reputation, and resilience.
If observability data does not clearly connect to those outcomes, it will never influence funding decisions—no matter how accurate or sophisticated the metrics are.
Translating Latency Into Lost Revenue
Latency is one of the most common metrics that causes executive disengagement.
Saying…
“P95 latency increased from 800ms to 1.6s”
… means very little on its own.
But reframing it as…
- “Checkout completion dropped 7% during peak traffic”
- “Customer service call volume increased 12%”
- “We exceeded our contractual SLA for 43 minutes during revenue-critical hours”
… changes the discussion immediately.
Latency is not a technical problem.
It is a conversion problem, a customer experience problem, or a brand trust problem, depending on where it occurs.
Rule of thumb:
Never present latency without explaining what it prevents a user from doing—and what that costs the business.
How to Present Observability Data to a CFO (Without Losing the Room)
CFOs are not anti-technology. They are anti-ambiguity.
Observability proposals and reports fail when they:
- Lead with infrastructure detail
- Contain too many charts
- Lack clear financial or operational exposure
A CFO-ready performance report should answer three questions—quickly and clearly.
1. Are we exposed right now?
- Are SLAs at risk?
- Are we trending toward breach?
- Is this occurring during critical business windows?
2. What happens if we do nothing?
- Revenue loss per hour
- Customer churn risk
- Contractual or regulatory penalties
- Increased support and recovery costs
3. What decision is required?
- Invest now or accept risk
- Fix, tolerate, or defer
- Prevent or react
Less is more.
One page is better than ten.
Trends matter more than raw metrics.
Outcomes matter more than technical precision.
From Observability to a “Business Health” Dashboard
Most organizations already have strong technical monitoring:
- APM platforms
- Infrastructure metrics
- Logs and traces
- Synthetic monitoring
The issue is rarely tooling.
The issue is translation.
Executives need a Business Health layer that sits above technical observability—not another system, but another perspective.
A Business Health dashboard should focus on:
- Availability – Can users complete critical actions?
- Performance Risk – Are we approaching thresholds that affect customers?
- Impact Radius – Which users, regions, or revenue streams are affected?
- Time to Failure – How long before this becomes a material incident?
This dashboard should intentionally avoid exotic or highly technical metrics.
No flame graphs.
No percentile debates.
No infrastructure topology diagrams.
Stick to concepts every leader understands:
- Downtime
- Slowdowns
- Failed transactions
- Missed commitments
Focus on Outcomes, Not Signals
Executives do not need to know everything that happened inside the system.
They need to know:
- What failed
- Who experienced it
- What it cost
- Whether it will happen again
Observability data becomes powerful only when it clearly answers “So what?”
That is how performance engineering shifts from being perceived as:
“An insurance policy we hope we never need”
to being recognized as:
A core business risk management capability.
Closing the Performance Literacy Gap
The organizations that succeed here don’t just invest in better tools.
They invest in better communication.
Because in the end, the problem isn’t that executives don’t care about performance.
It’s that IT leaders are not consistently translating technical insight into the business language where funding, prioritization, and strategic decisions are made.
When performance data is framed in terms of business impact, risk exposure, and financial consequence, funding conversations change—and so does the organization’s ability to prevent failures before customers feel them.
Stop managing milliseconds and start managing risk.
If your performance data is being dismissed as “noise” by your C-suite, it’s time to bridge the Performance Literacy Gap. Foulk Consulting specializes in transforming complex observability signals into clear, financial, and operational business outcomes.
Ready to turn your performance data into a business risk management capability?
Contact us today to schedule a strategic review.