
By Nate Rich, Principal Engineer at Foulk Consulting
Every year, enterprise IT teams invest heavily in state-of-the-art observability software—from Dynatrace and New Relic to Datadog and OpenTelemetry. The pitch is irresistible: total visibility into distributed microservices, instant root-cause analysis, and single-pane-of-glass dashboards.
Yet, months after deployment, many leadership teams find themselves asking the same frustrating questions:
- Why are our SREs and developers still inundated with hundreds of nightly alerts?
- Why is our cloud telemetry bill growing faster than our business revenues?
- Why did our last major outage take three hours to resolve if we have “full visibility”?
The answer lies in a common misconception: confusing the purchase of observability technology with the operation of a mature observability practice.
Implementing tooling is only step one. The real ROI emerges through continuous data analysis, aggressive alert tuning, contextual incident response, and ongoing architectural optimization. Let’s break down the critical differences between traditional monitoring, baseline observability, and a fully Managed Observability practice.
1. The Spectrum: From Monitoring to Managed Observability
To understand where your organization sits, it helps to view these capabilities as a maturity model rather than binary choices.
| Dimension | Traditional Monitoring | Baseline Observability | Managed Observability |
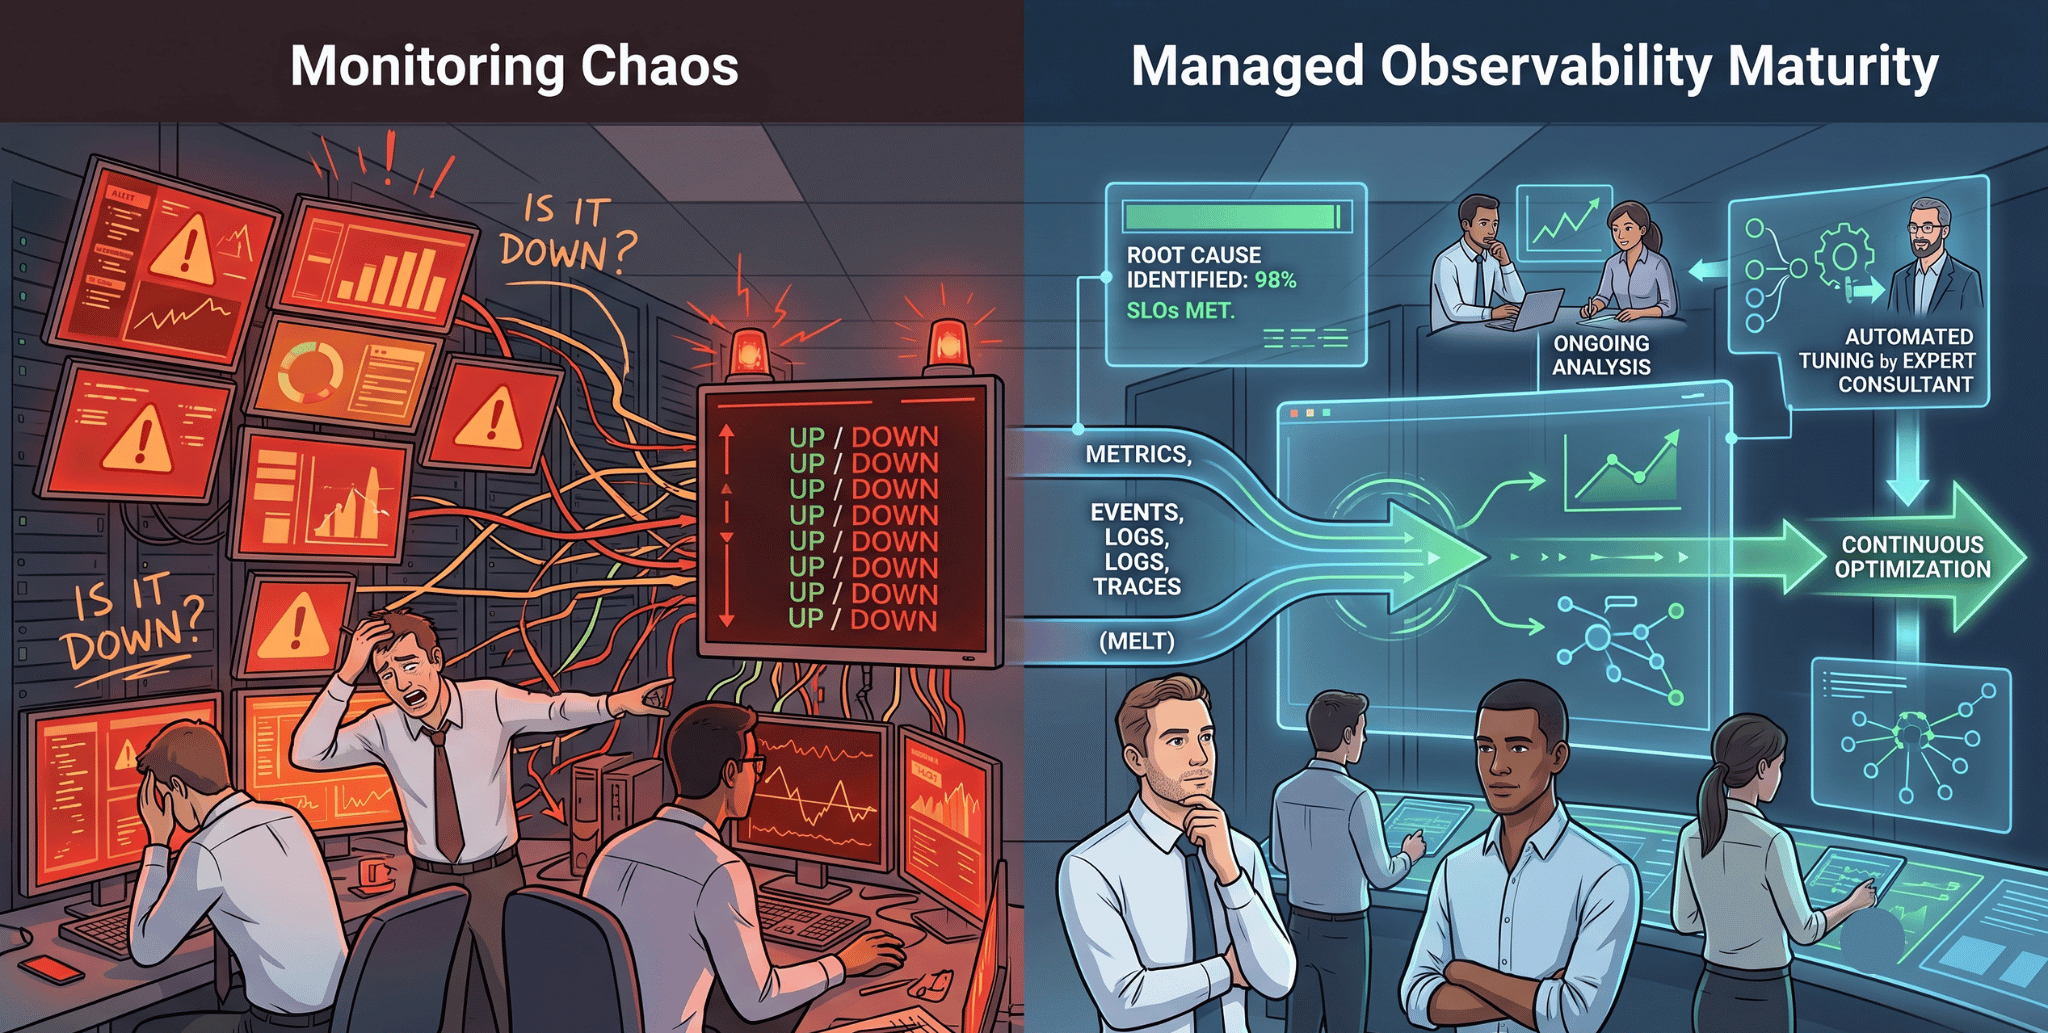
| Primary Question | “Is the system up or down?” | “Why is the system behaving this way?” | “How do we continuously optimize system health & business outcomes?” |
| Data Scope | Isolated metrics & server logs (CPU, RAM, HTTP 200/500). | Correlated Telemetry: Metrics, Events, Logs, and Traces (MELT). | Telemetry mapped directly to business transactions, user experience, and SLOs. |
| Approach | Reactive: Triggers alerts when static thresholds are breached. | Diagnostic: Provides rich data so engineers can query “unknown unknowns.” | Proactive & Adaptive: Continuous tuning, automated routing, and proactive anomaly prevention. |
| Primary Challenge | Siloed visibility & blind spots. | High noise, alert fatigue, runaway ingestion costs, and “dashboard graveyards.” | Requires dedicated focus and specialized expertise to maintain operational rigor. |
Traditional Monitoring (Reactive)
Traditional monitoring answers the question: Is something broken? It relies on pre-defined static thresholds—like an alert firing when CPU usage on a server exceeds 85% for five minutes. While essential for basic health checks, modern cloud-native architectures are too complex and dynamic for static rules alone.
Baseline Observability (Diagnostic)
Observability shifts the focus to: Why is it broken? By collecting high-cardinality metrics, logs, traces, and events (MELT), observability allows engineers to inspect the internal state of a complex system based on its external outputs. However, owning an observability tool simply gives you access to a massive ocean of data. If nobody is continually curating that data, it quickly turns into digital noise.
Managed Observability (Outcome-Centric)
Managed Observability elevates technology into an operational practice. It treats telemetry not as raw data to hoard, but as a critical business asset that requires continuous curation, governance, and analysis. Managed Observability pairs advanced platforms with dedicated IT Operations Management (ITOM) expertise to ensure alerts are meaningful, dashboards drive decision-making, and ingestion costs stay aligned with business value.
2. The DIY Observability Trap: Why Tools Alone Fall Short
When enterprise engineering teams attempt to manage modern observability platforms on top of their day-to-day delivery responsibilities, they routinely run into three major roadblocks:
1. The “Dashboard Graveyard” & Alert Fatigue
Engineers build dozens of custom dashboards during initial onboarding. Over time, as codebases evolve and teams shift, those dashboards become stale. Meanwhile, alert thresholds remain uncalibrated, blasting Slack channels and PagerDuty schedules with false positives. When everything generates an alert, nothing gets prioritized.
2. Telemetry Cost Explosions
Observability platforms typically charge based on data ingestion volume. Without active data hygiene—such as filtering out redundant debug logs, optimizing sample rates for distributed traces, and dropping low-value metrics—organizations end up paying thousands of dollars every month for raw data nobody ever queries.
3. SRE & Developer Burnout
Your senior SREs and platform engineers should be focused on building resilient architecture, automating infrastructure, and pushing high-value features. Expecting them to simultaneously act as full-time observability tool administrators, dashboard maintainers, and platform tuners drains their bandwidth and leads to operational drift.
3. The Four Pillars of Managed Observability
A mature, managed practice ensures your observability ecosystem actively works for your team, rather than adding to their workload. At Foulk Consulting, we anchor our Managed Observability engagements around four foundational pillars:
Key Takeaway: Tooling gives you visibility, but continuous management gives you control.
Pillar 1: Continuous Alert Tuning & Signal Curation
Systems change constantly with every deployment. Managed Observability includes ongoing review loops to eliminate noisy alerts, establish dynamic anomaly detection baselines, and ensure that when an engineer receives an alert, it represents an actionable, high-priority issue.
Pillar 2: Alignment with Business KPIs & Service Level Objectives (SLOs)
Technical metrics mean very little if they aren’t tied to business realities. A 100ms increase in database latency might be harmless for a batch processing job, but disastrous for an e-commerce checkout flow. Managed Observability maps telemetry directly to key business transactions, user experience metrics, and Service Level Objectives (SLOs).
Pillar 3: Telemetry Cost & Ingestion Governance
Managing data lifecycle strategies ensures you get maximum insight at minimal cost. By implementing smart sampling rules, log aggregation policies, and automated retention schedules, a managed practice keeps platform spending predictable without sacrificing deep diagnostic capabilities.
Pillar 4: Post-Incident Feedback Loops
The true value of an incident is the architectural lesson it teaches you. A managed practice conducts deep-dive technical reviews following major events to ensure telemetry coverage gaps are identified and filled—preventing similar blind spots in the future.
4. Unlocking Operational Excellence with Foulk Consulting
Achieving high-maturity IT Operations Management doesn’t require ballooning your internal headcounts or drowning your developers in tool maintenance.
At Foulk Consulting, we partner with enterprise teams to bridge the gap between owning observability software and operating a high-performing observability practice. Whether you are looking to optimize your existing platform investments (such as New Relic, Dynatrace, or Datadog), reduce Mean Time to Resolution (MTTR), or institute automated performance engineering across your release pipelines, our ITOM specialists provide the hands-on expertise needed to drive measurable business outcomes.
Ready to elevate your observability posture?
Stop swimming in raw telemetry data and start extracting actionable intelligence. Contact Foulk Consulting today to schedule an Observability Maturity Assessment with our engineering team.

*** Nate Rich is a Principal Engineer at Foulk Consulting, where he helps enterprises master performance engineering and full-stack observability.
