

By Nate Rich, Senior Director, ITSM and Observability Management at Foulk Consulting
Every modern enterprise engineering team has experienced the classic 3:00 AM war room scenario:
A critical customer-facing service degrades. Inside New Relic, APM alerts turn crimson, distributed traces pinpoint an unhandled database query timeout from a deployment 20 minutes ago, and Golden Signals start flatlining. Meanwhile, inside ServiceNow, forty distinct automated alerts flood the incident queue, generating separate high-priority tickets assigned to three different triage queues.
By the time the on-call engineers copy-paste stack traces into ticket comments, untangle alert noise, and determine which service actually owns the root cause, an hour of customer impact has elapsed.
This disconnect isn’t a tooling failure, it’s an integration and architectural divide.
Most enterprises treat observability (telemetry, APM, logging) and IT Service Management (ITSM/ITOM, workflow automation, CMDB) as isolated islands. To achieve true operational resilience, organizations must build what we at Foulk call “The Observability Handshake,” a bidirectional bridge that translates real-time telemetry into context-rich, automated workflows.
The Symptom: Alerting is Not Resolution
Historically, the integration between monitoring platforms and ITSM tools has been crude: a web hook fires on threshold breach, creating an incident ticket that contains little more than:
CRITICAL: Host CPU Utilization > 95% on ip-10-0-4-112
This naive pattern causes three distinct enterprise bottlenecks:
- Alert Fatigue and Ticket Sprawl: A single microservice failure cascades upstream and downstream, triggering dozens of disconnected tickets across infrastructure, network, and application teams.
- Missing Architectural Context: An engineer viewing the ticket doesn’t know what service that host belongs to, which recent commit ran against it, or who the business owner is.
- Manual Pivot-to-Investigate Overhead: Engineers must leave ServiceNow, log into New Relic, manually search for the timeframe, find the relevant distributed traces, and correlate logs.
The goal is not to send more alerts into ServiceNow. The goal is to send actionable, contextual intelligence that drives automated triage and resolution.
Architectural Blueprint: The Four Pillars of the Handshake
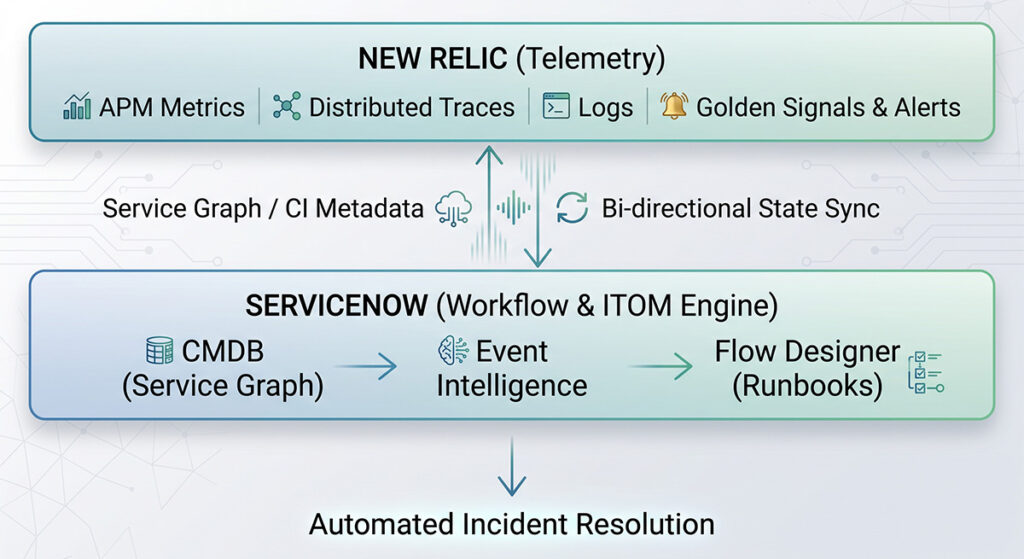
1. CMDB & Telemetry Alignment via Service Graph Connectors
A resilient integration begins at the data layer. You cannot resolve an incident efficiently if your observability entity names don’t map to your Configuration Items (CIs) in the ServiceNow Configuration Management Database (CMDB).
By leveraging bi-directional metadata alignment (such as the ServiceNow Service Graph Connector for New Relic), telemetry entities (APM services, cloud hosts, Kubernetes clusters, synthetic monitors) are mapped directly to business service maps in ServiceNow.
- The Result: When New Relic detects latency in an API gateway, ServiceNow instantly knows which business applications, customer tiers, and operational owners are impacted.
2. Upstream Correlation and Noise Reduction
Flooding ServiceNow Event Management with raw alerts defeats the purpose of workflow automation. The handshake uses New Relic’s Applied Intelligence and ServiceNow ITOM correlation engines to:
- Aggregate correlated anomalies into a single correlated incident.
- Suppress transient blips using dynamic baseline thresholds.
- Bind logs, error traces, and deployment markers directly into the parent incident payload.
3. Deep Context Injection
When a ServiceNow incident record is generated, it should not require detective work. The handshake ensures the ticket is pre-populated with:
- Direct Deep Links: One-click navigation back to the exact New Relic transaction trace, entity dashboard, or log stream.
- Blast Radius Mapping: Visual dependencies showing upstream services and downstream database dependencies.
- Deployment Context: Recent CI/CD deployment markers, changelogs, and commit hashes flagged within the incident timeline.
4. Bi-Directional State Synchronization & Automated Runbooks
The handshake is a two-way street:
- State Mirroring: Acknowledging an incident, assigning an engineer, or snoozing an alert in ServiceNow automatically updates the alert state and mutes downstream notification channels in New Relic.
- Workflow Automation (Flow Designer): If a known issue occurs (e.g., an orphaned thread pool causing memory leakage on a worker node), ServiceNow Flow Designer can trigger an automated remediation action (such as executing a runbook to restart the pod or scale an auto-scaling group) before a human ever touches the ticket.
The Operational Transformation: Before vs. After
| Operational Metric | Isolated Silos (Traditional) | The Observability Handshake |
| Alert-to-Incident Ratio | 1:1 (High ticket noise and duplication) | Many:1 (Correlated, deduped incidents) |
| Mean Time to Acknowledge (MTTA) | Minutes lost to triage and assignment | Near-instant routing based on CMDB service ownership |
| Mean Time to Resolve (MTTR) | Extended by manual trace gathering | Slashed by automated context injection and runbooks |
| Root Cause Analysis (RCA) | Fragmented post-mortems across tools | Unified timeline: deployment markers + telemetry + incident audit trail |
Getting Started: The Foulk Approach
Moving from chaotic alerting to unified incident resolution does not require overhauling your entire stack overnight. At Foulk Consulting, we recommend a phased implementation:
- Audit & Standardize Tagging: Establish consistent metadata schemas across New Relic APM agents and ServiceNow CIs (Environment, ServiceName, Owner, Tier).
- Implement Service Graph Integration: Ingest and synchronize infrastructure and application topologies into ServiceNow ITOM.
- Refine Alert Policies & Routing: Transition alert conditions from static thresholds to anomaly-based golden signals, funneling them through ServiceNow Flow Designer.
- Deploy Self-Healing Runbooks: Identify the top 3–5 recurring operational incidents and automate their remediation workflows end-to-end.
Modernize Your Incident Lifecycle
If your engineers are still spending the first 30 minutes of every outage playing telephone between telemetry dashboards and ticket queues, your tools are working in opposition. Bridging New Relic and ServiceNow turns telemetry into immediate, coordinated operational action.
Want to evaluate your organization’s observability and ITSM maturity? Connect with the Foulk Consulting engineering team to schedule an architectural assessment.

*** Nate Rich is a Principal Engineer at Foulk Consulting, where he helps enterprises master performance engineering and full-stack observability.
