
By Nate Rich, Principal Engineer, Foulk Consulting
We’ve all seen the horror stories: a company migrates to a modern observability platform, only to receive a monthly bill that rivals their actual infrastructure spend.
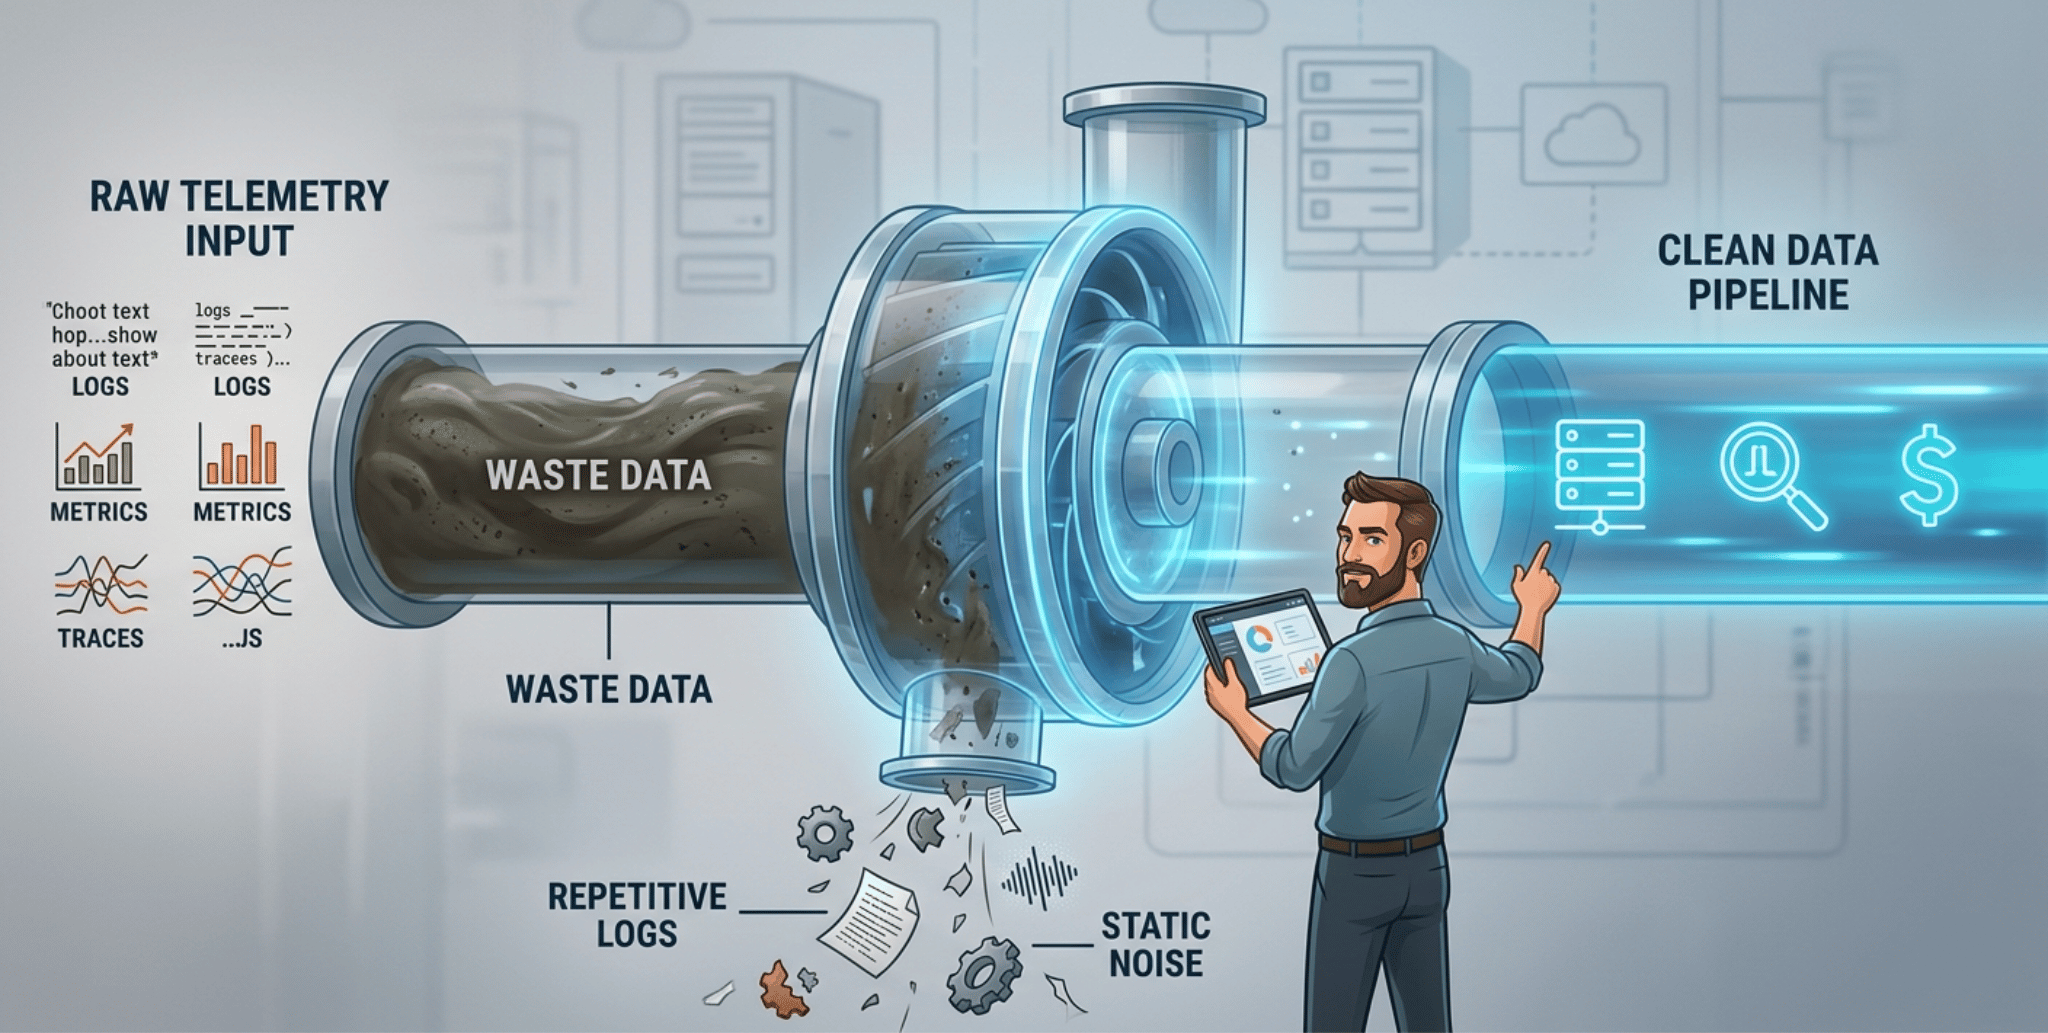
When your observability costs start scaling faster than your revenue, the gut reaction is usually to blame the vendor’s pricing model. But if we’re being completely honest with ourselves, the vendor isn’t the primary problem. The problem is that we are paying them to store trash.
In my previous posts, I’ve talked extensively about reducing alert fatigue and optimizing your monitoring environments. But fixing your alerts and dashboards is fixing the symptoms. To cure the disease, we have to look upstream at the data pipeline itself.
If you want to rescue your budget without sacrificing system visibility, you have to stop ingesting low-value telemetry at the source. Here is a pragmatic guide to cleaning up your pipeline.
The Core Problem: The “Collect Everything” Fallacy
For years, the industry mantra was “collect everything, ask questions later.” Storage was cheap, and computing power was plentiful.
But modern cloud-native architectures (microservices, Kubernetes, ephemeral serverless functions) have turned that philosophy into a financial liability. A single debugging log or a high-cardinality metric loop can generate terabytes of useless data in a matter of hours.
The Golden Rule of Modern Observability: Data should only be ingested if it actively drives operational value, informs debugging, or meets a strict compliance requirement. If it doesn’t do one of these three things, it’s digital landfill.
To fix this, we need to transition from passive data acceptance to active data management.
3 Strategies to Clean the Pipeline
1. Push Filtering to the Edge (Leverage OpenTelemetry Collectors)
The single biggest mistake teams make is sending raw telemetry directly from their applications to their paid observability vendor. By the time the vendor’s endpoint receives the data, the billing meter has already run.
Instead, implement a robust gateway layer using OpenTelemetry (OTel) Collectors or local agents.
- Drop at the door: Use processors within the OTel Collector to drop known low-value logs (like routine HTTP 200 OK health check requests from load balancers) before they ever leave your network.
- Control the flow: The edge is your security checkpoint. If data doesn’t pass the utility test, it doesn’t cross the threshold into your budget.
2. Attack the Log Hoarders (Sampling and Deduplication)
Logs are almost always the heaviest, most expensive component of an observability bill. They are also repetitive. If a service fails, it doesn’t just log an error once; it might log the exact same stack trace 50,000 times a minute.
- Dynamic Sampling: You don’t need 100% of successful transaction logs to know your system is healthy. Implement tail-based sampling. Keep 1% of successful transactions for baseline tracing, but keep 100% of errors or high-latency traces.
- Deduplication: Configure your log pipelines to identify repetitive, identical error strings. Ingest the first occurrence, increment a counter at the edge, and drop the next 9,999 identical logs. You get the context without the invoice.
- Enforce Log Level Discipline: Production environments should rarely run on DEBUG or INFO levels globally. Tie log-level shifts to automated deployment flags or temporary troubleshooting windows, rather than leaving them on indefinitely.
3. Ruthlessly Prune High-Cardinality Metrics
Metrics are incredibly powerful, but high cardinality (metrics with too many unique label combinations) is a silent budget killer.
If you tag a container metric with a user_id or a specific order_id, you are creating millions of unique time-series data points that your vendor will charge you to index.
- Audit your tags: Look at your metric labels. Do you actually aggregate dashboards by that specific variable? If nobody is querying it, strip the tag out at the collector level.
- Thin the frequency: Does your infrastructure health metric need to be scraped every 1 second, or is 10 or 15 seconds sufficient for standard alerting? Dropping scrape frequency can instantly slash your metric volume by 80% without losing macro-level visibility.
Operational Value is the Only Metric That Matters
Cleaning your observability data pipeline isn’t about flying blind or starving your engineering teams of data. It’s about stewardship.
When you stop paying to ingest trash, two beautiful things happen simultaneously:
- Your vendor bills plummet, freeing up capital for actual engineering innovation.
- Your system performance improves. Engineers can find answers faster because they don’t have to wade through oceans of noise to find the one relevant signal during an incident.
Take a look at your ingestion pipelines this week. Run an audit on your top five most expensive log sources and metric tags. You’ll likely find that a few small, pragmatic cuts at the source will yield massive relief for your budget.
Need help auditing your observability pipeline and cutting wasted spend? Let’s talk about how Foulk Consulting can help optimize your monitoring environment.

*** Nate Rich is a Principal Engineer at Foulk Consulting, where he helps enterprises master performance engineering and full-stack observability.
